Light
Seconds to log
Open. Tap. Done. So little friction that tracking becomes a habit instead of a project.
The one-tap tracker
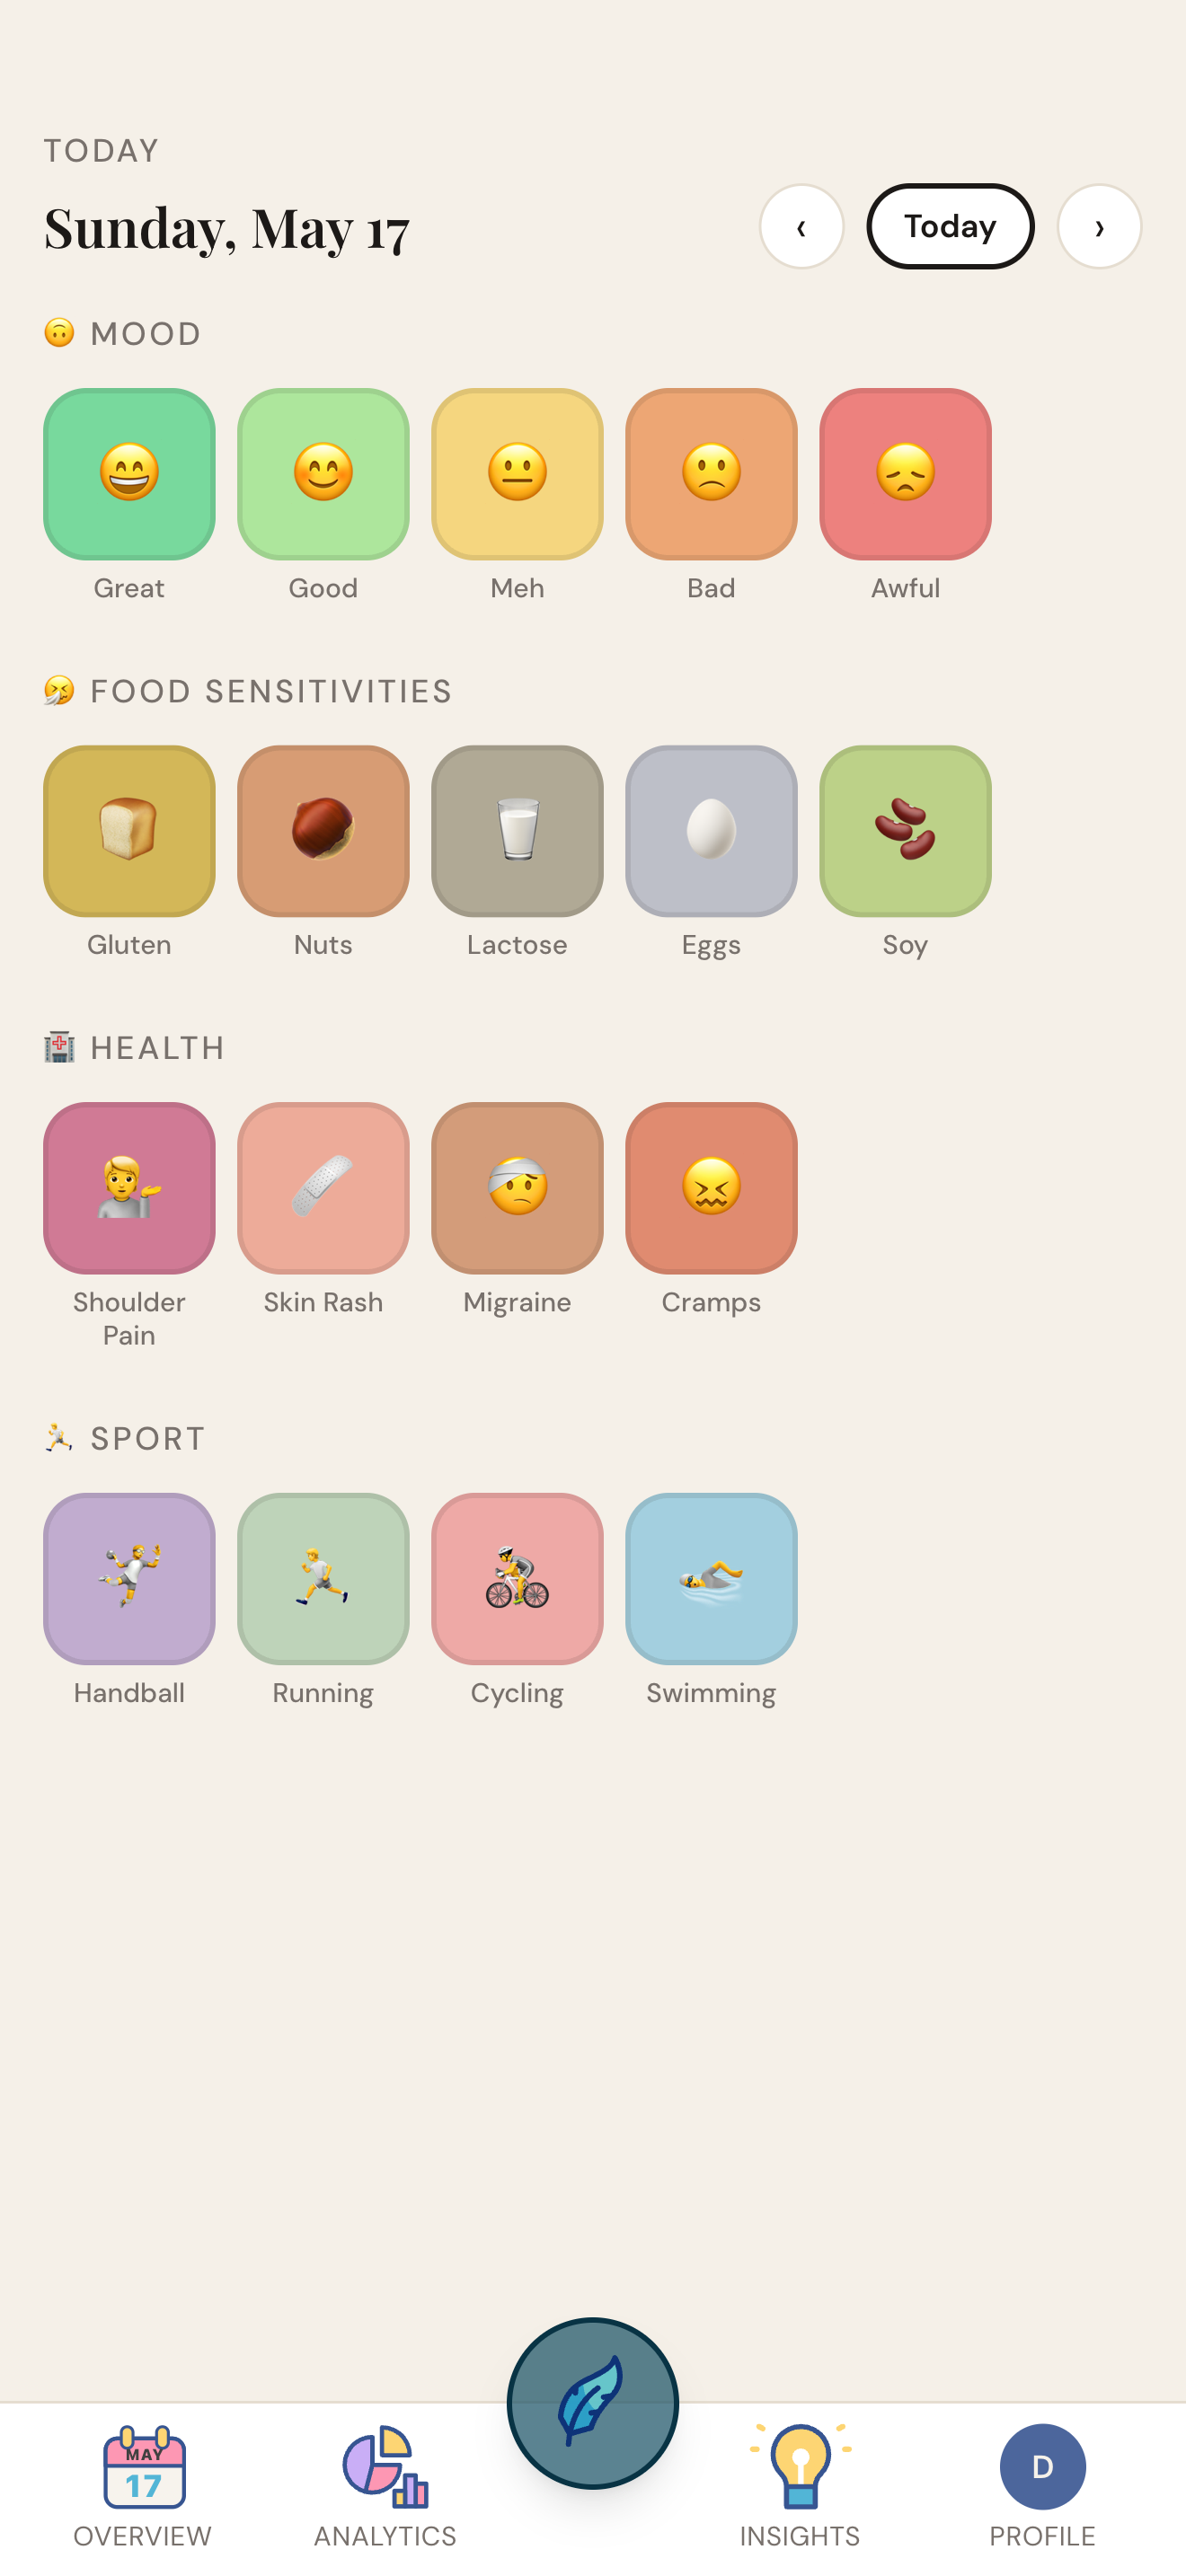
Log Simply is a tracker you build yourself. Mood, meals, migraines, workouts, sleep — you decide what to keep an eye on, and logging it takes a second. Over time, it shows you how it all connects.
Calm and private
Light
Open. Tap. Done. So little friction that tracking becomes a habit instead of a project.
Calm
Nothing to keep up with, nothing to unlock. It’s a tracker, not a coach. Free — and accounts created free stay free.
Private
Your entries are stored anonymously in a secured database in Switzerland. Only you have access.
Yours
Back up or move on with a one-tap export to XLSX, CSV or JSON. We don’t lock you in.
How it works
01
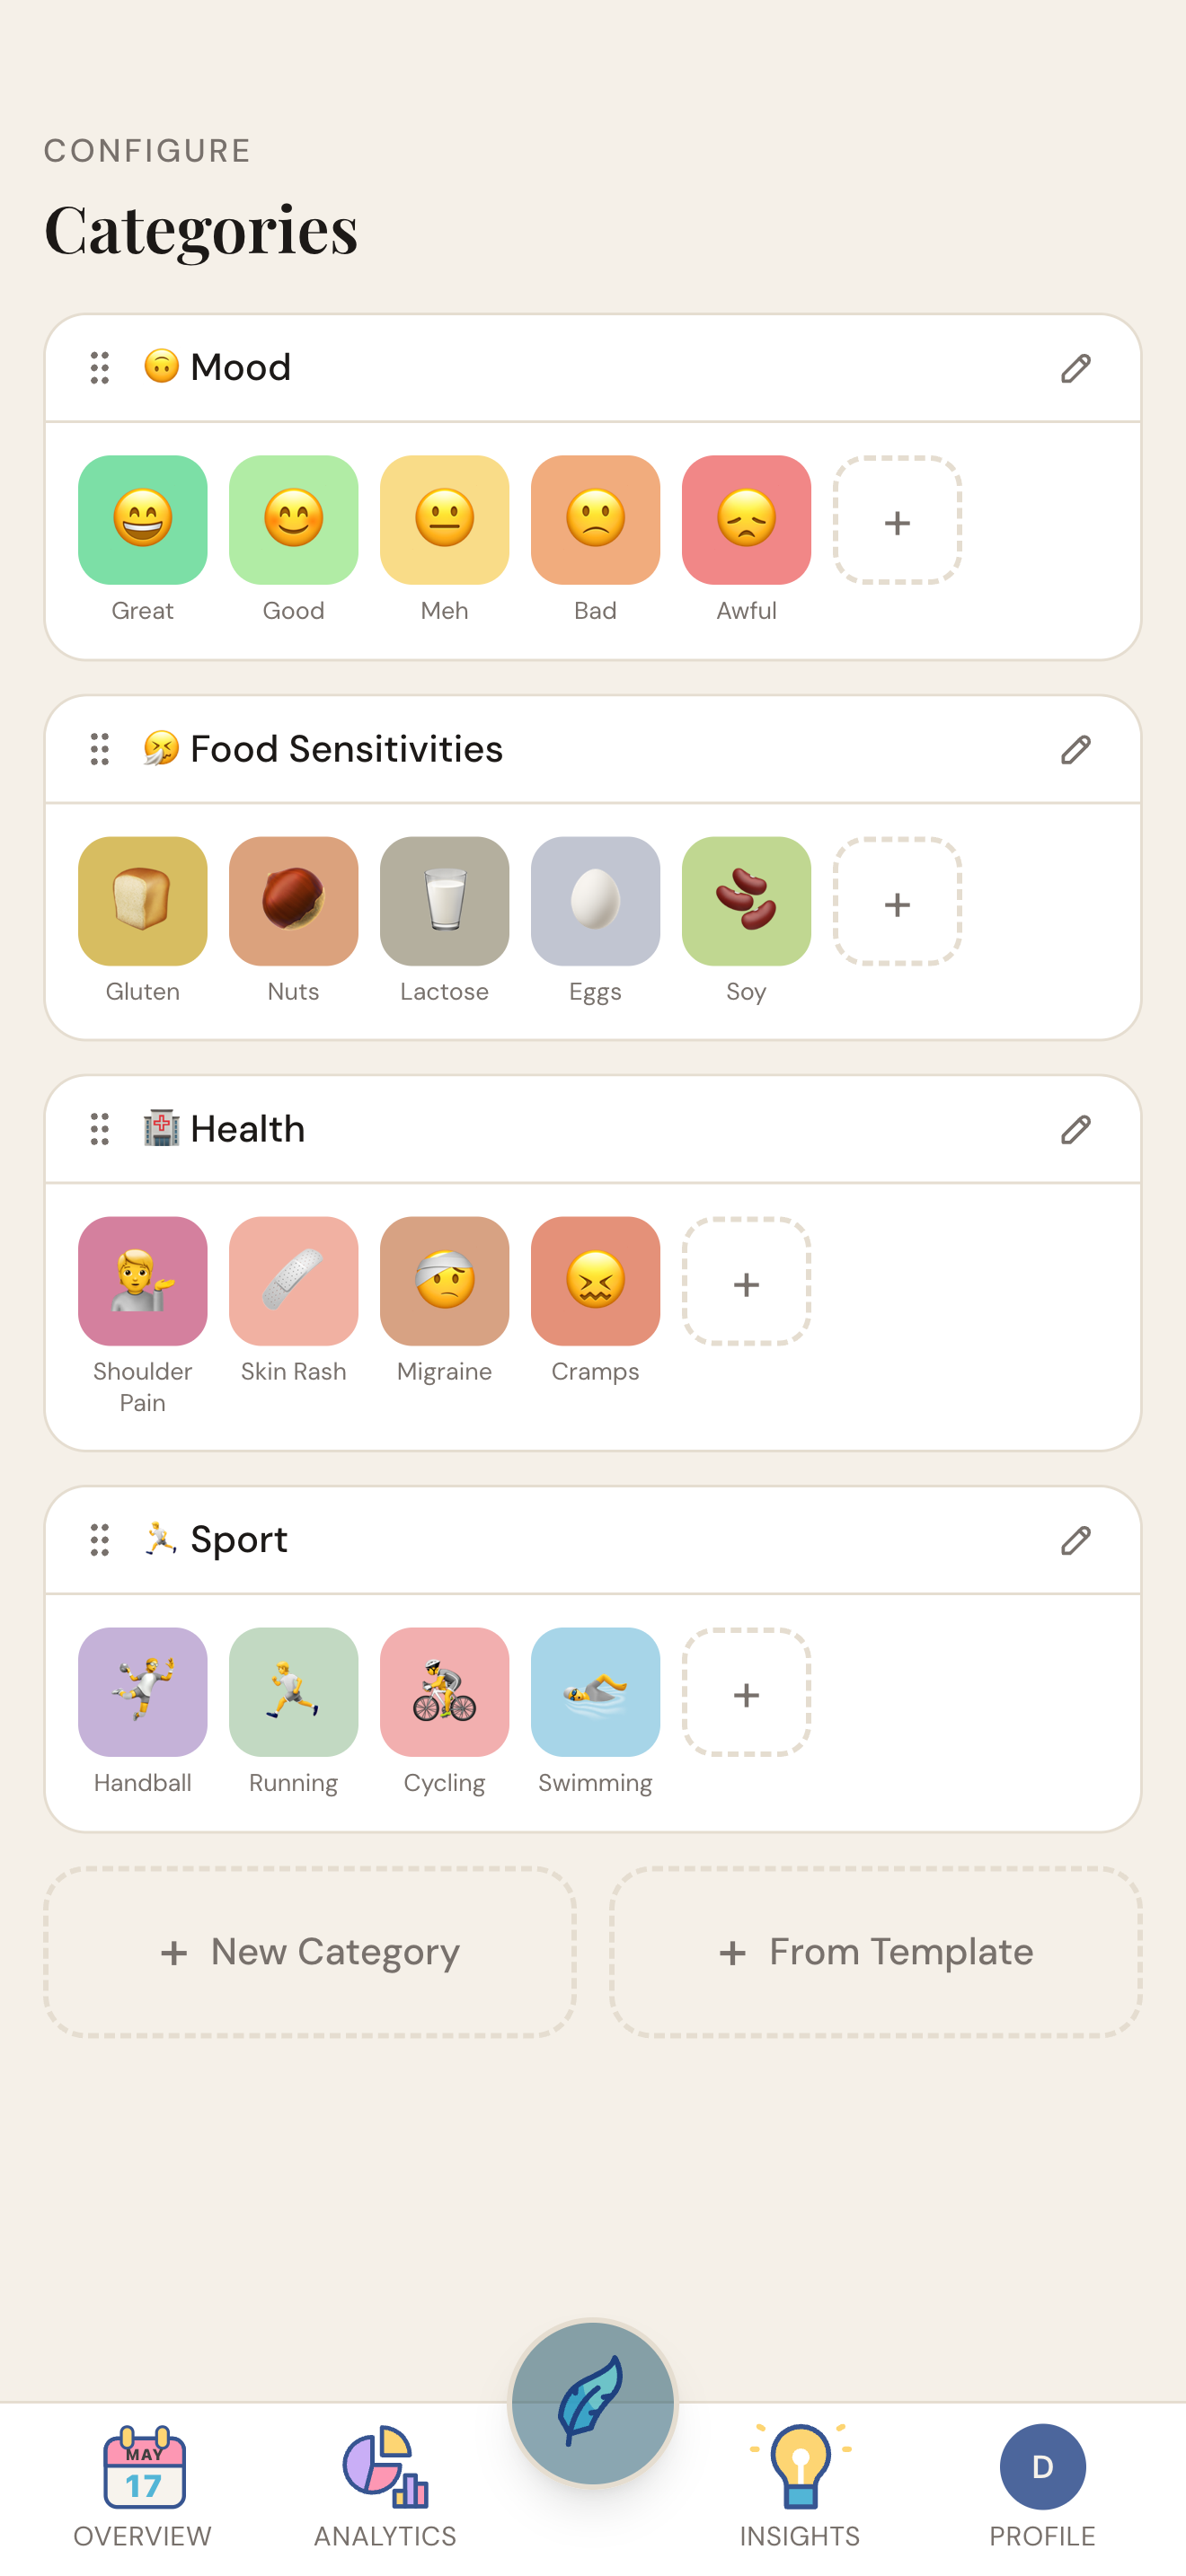
Create a tile for whatever you want to keep an eye on — start from a curated template or build from scratch. Drag to arrange; long-press to change icon, color and details.
02
Log simply by tapping a tile — the entry is timestamped and done. Add duration, count, rating or a note only when you want to.
03
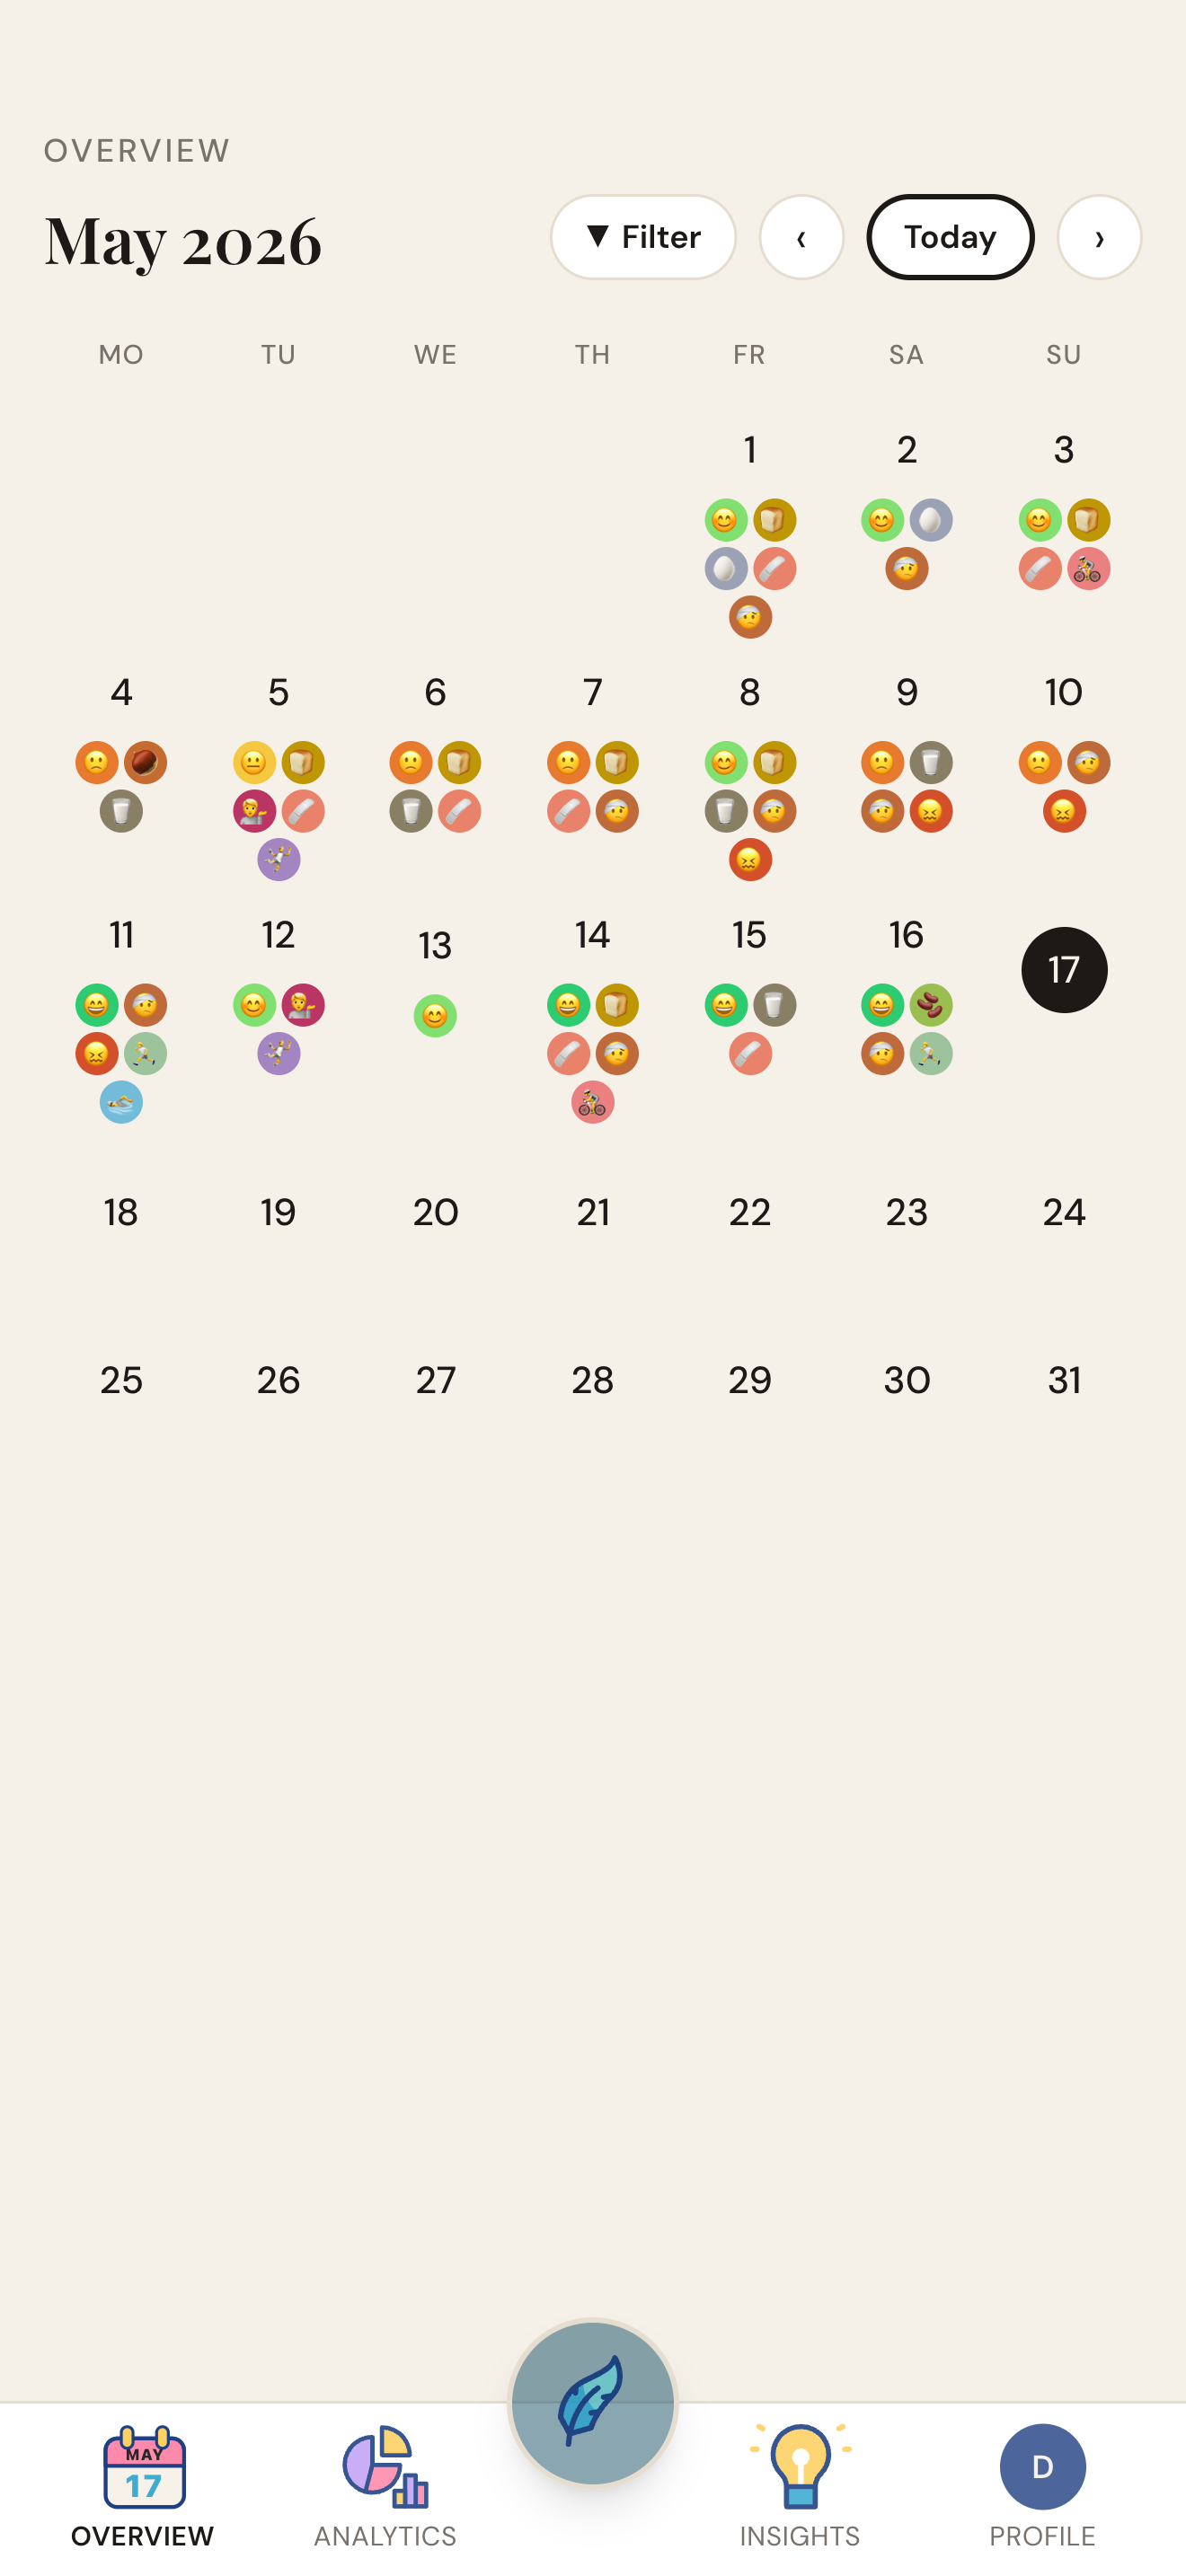
Every day becomes a small constellation of icons. Long-press a dot to read its details; tap a day to step inside it.
04
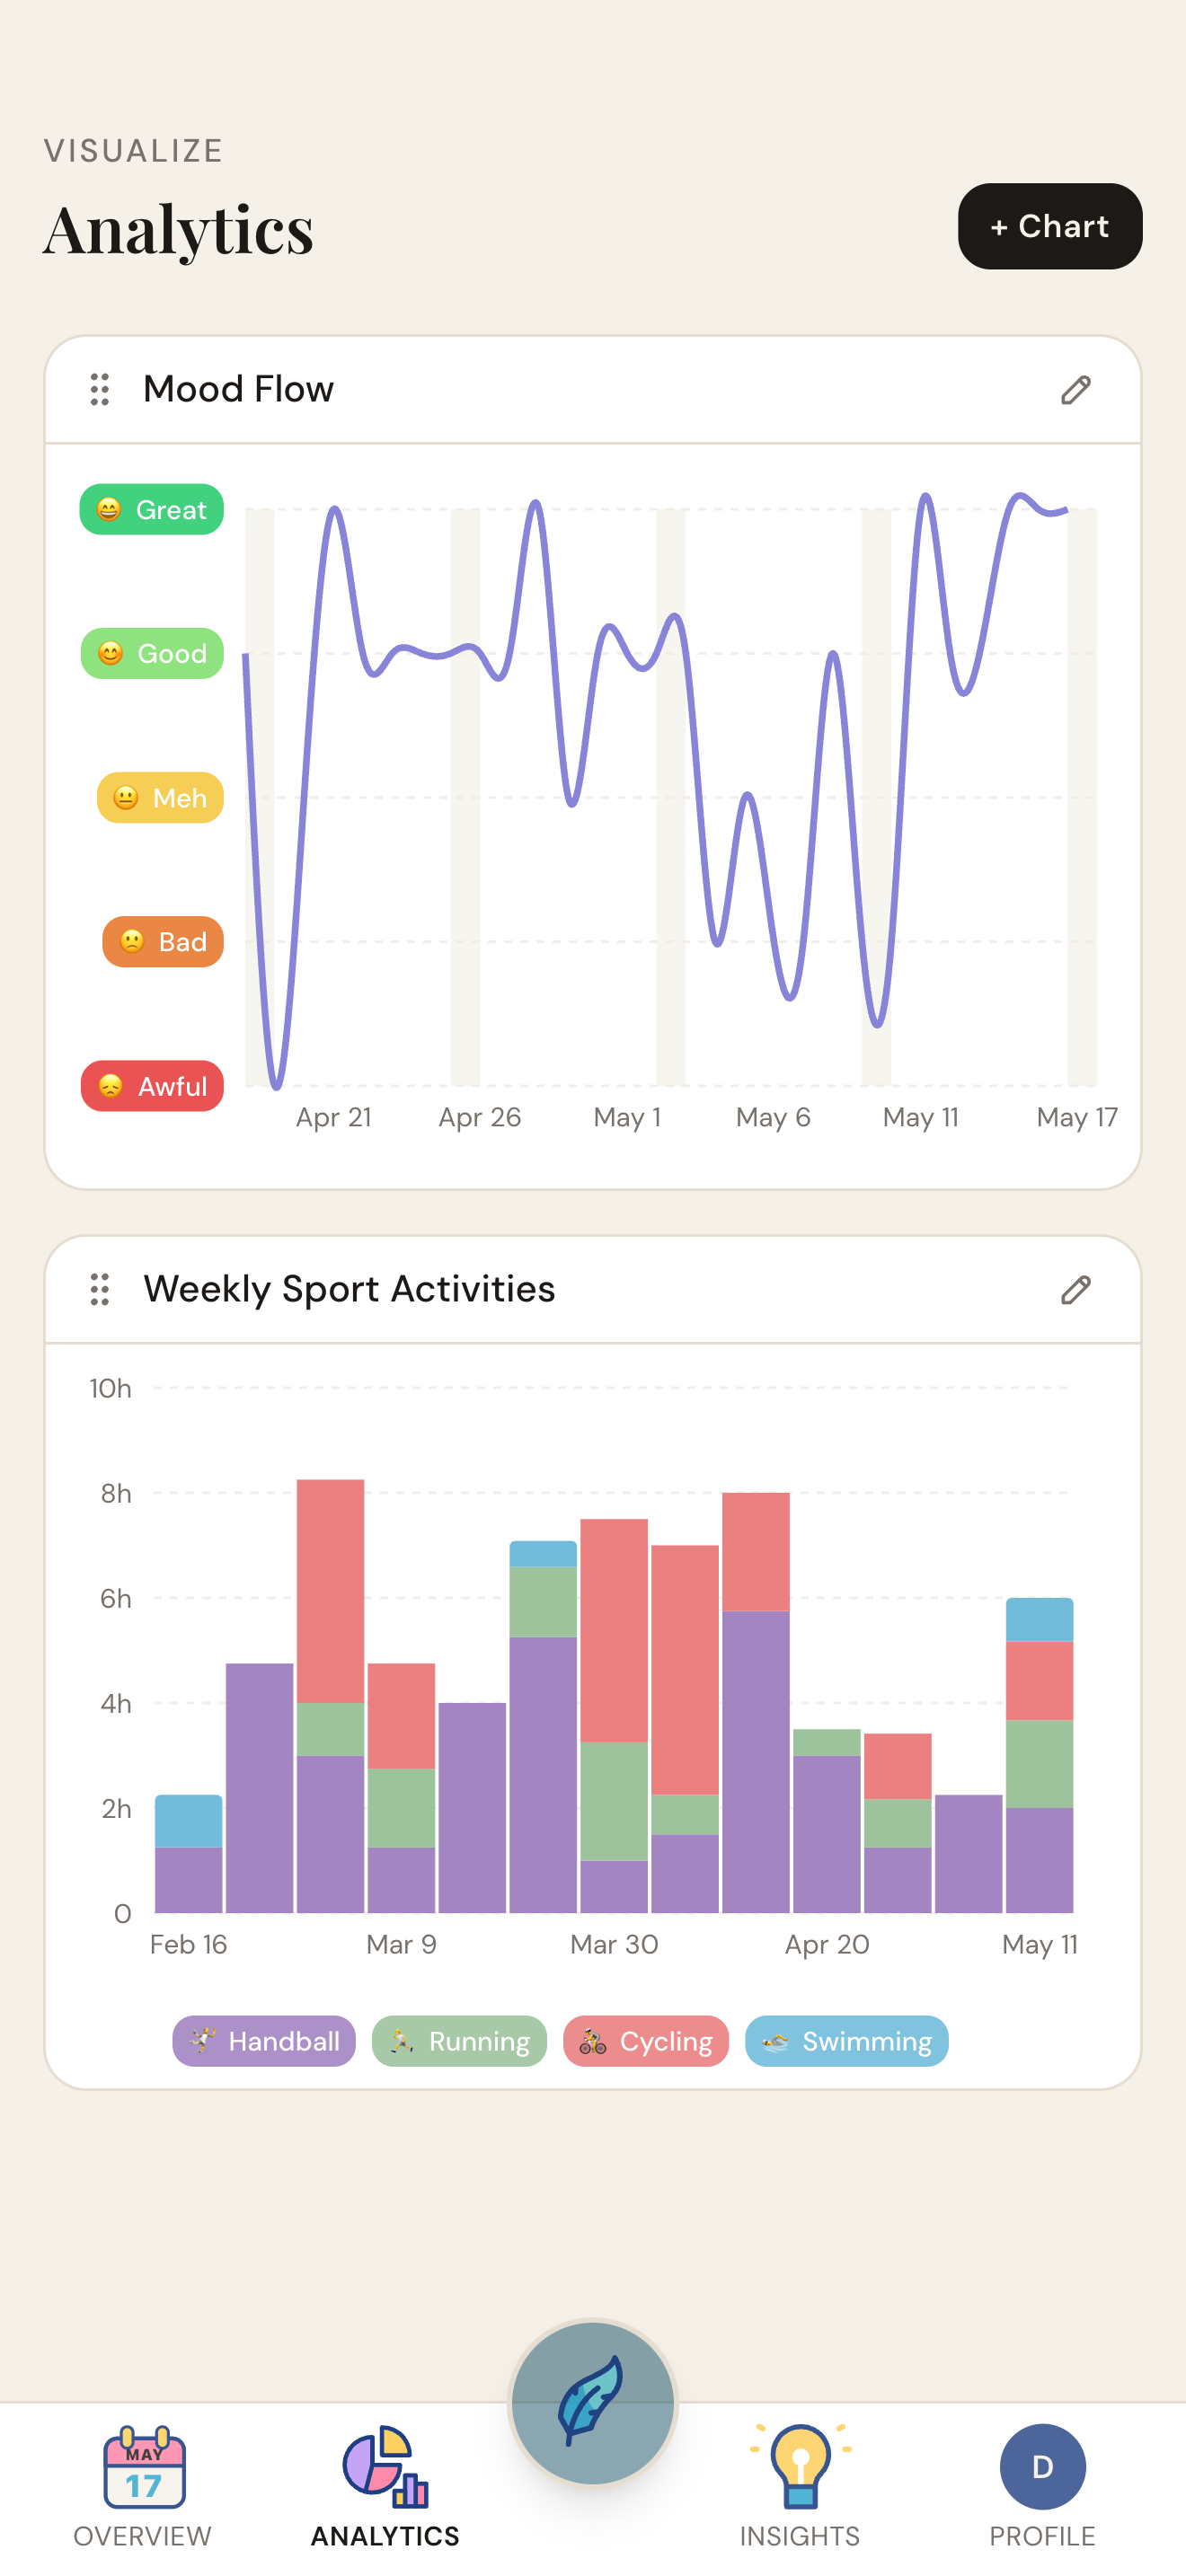
Compose your own charts — lines, stacked bars, pies, state timelines. Every chart comes with its statistics: totals, averages, peak days, trend, and a comparison with the previous period.
05
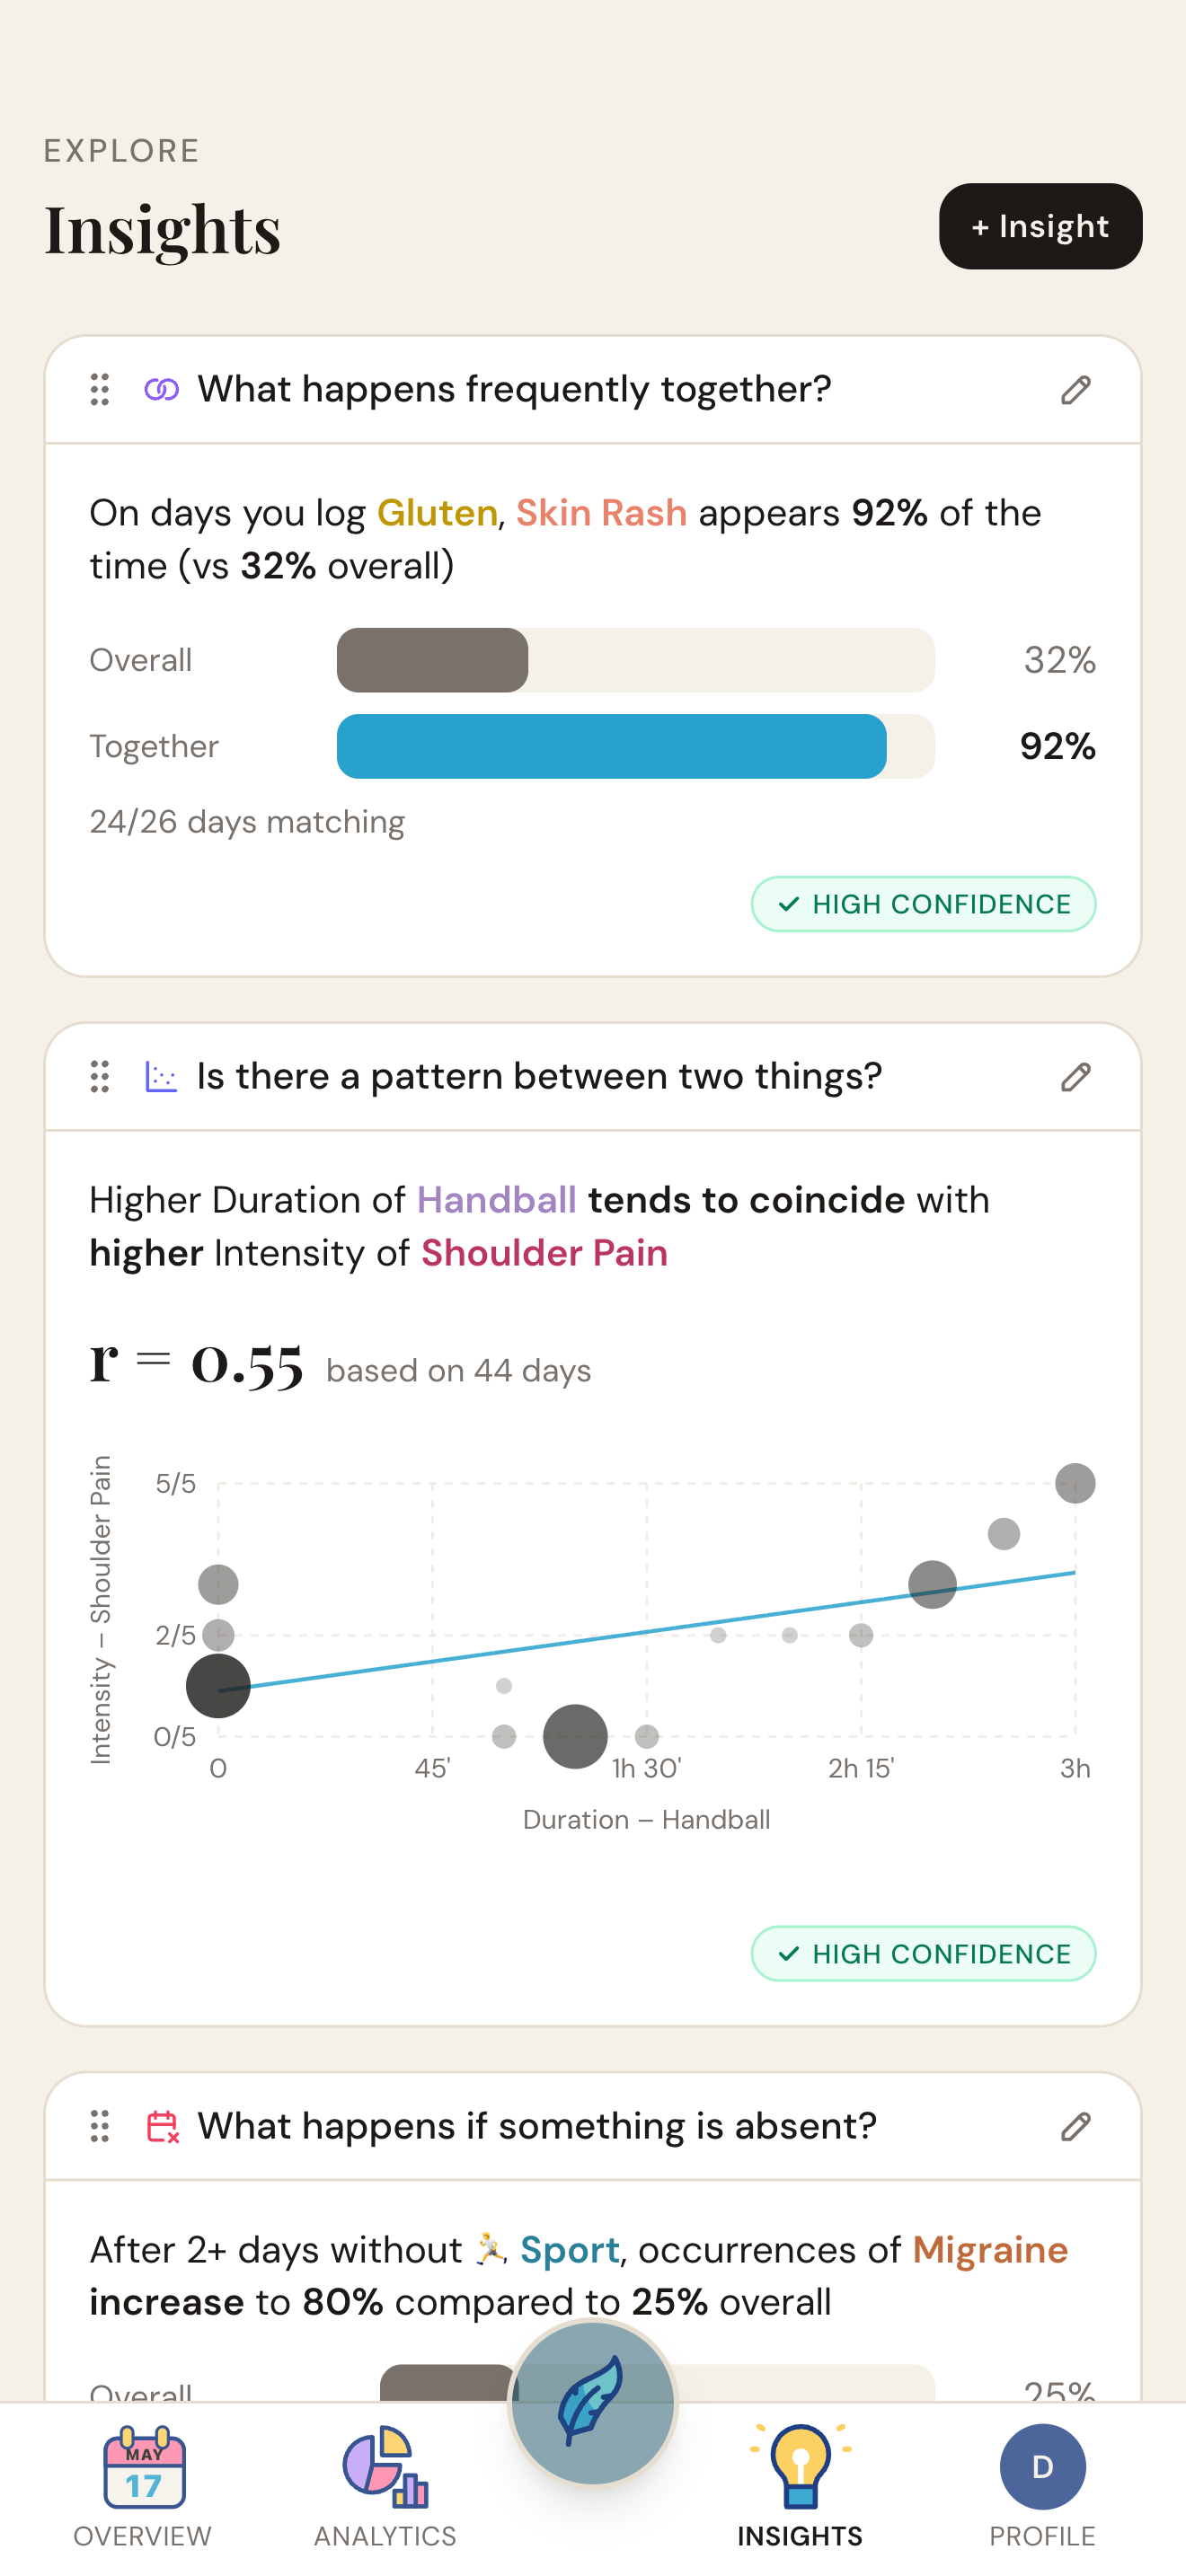
Log Simply looks for connections between your entries and shows the ones that hold up — like “On days you log gluten, skin rash appears 92% of the time.” Computed on your device; only you can see them.
01
Create a tile for whatever you want to keep an eye on — start from a curated template or build from scratch. Drag to arrange; long-press to change icon, color and details.
02
Log simply by tapping a tile — the entry is timestamped and done. Add duration, count, rating or a note only when you want to.
03
Every day becomes a small constellation of icons. Long-press a dot to read its details; tap a day to step inside it.
04
Compose your own charts — lines, stacked bars, pies, state timelines. Every chart comes with its statistics: totals, averages, peak days, trend, and a comparison with the previous period.
05
Log Simply looks for connections between your entries and shows the ones that hold up — like “On days you log gluten, skin rash appears 92% of the time.” Computed on your device; only you can see them.
Match your style
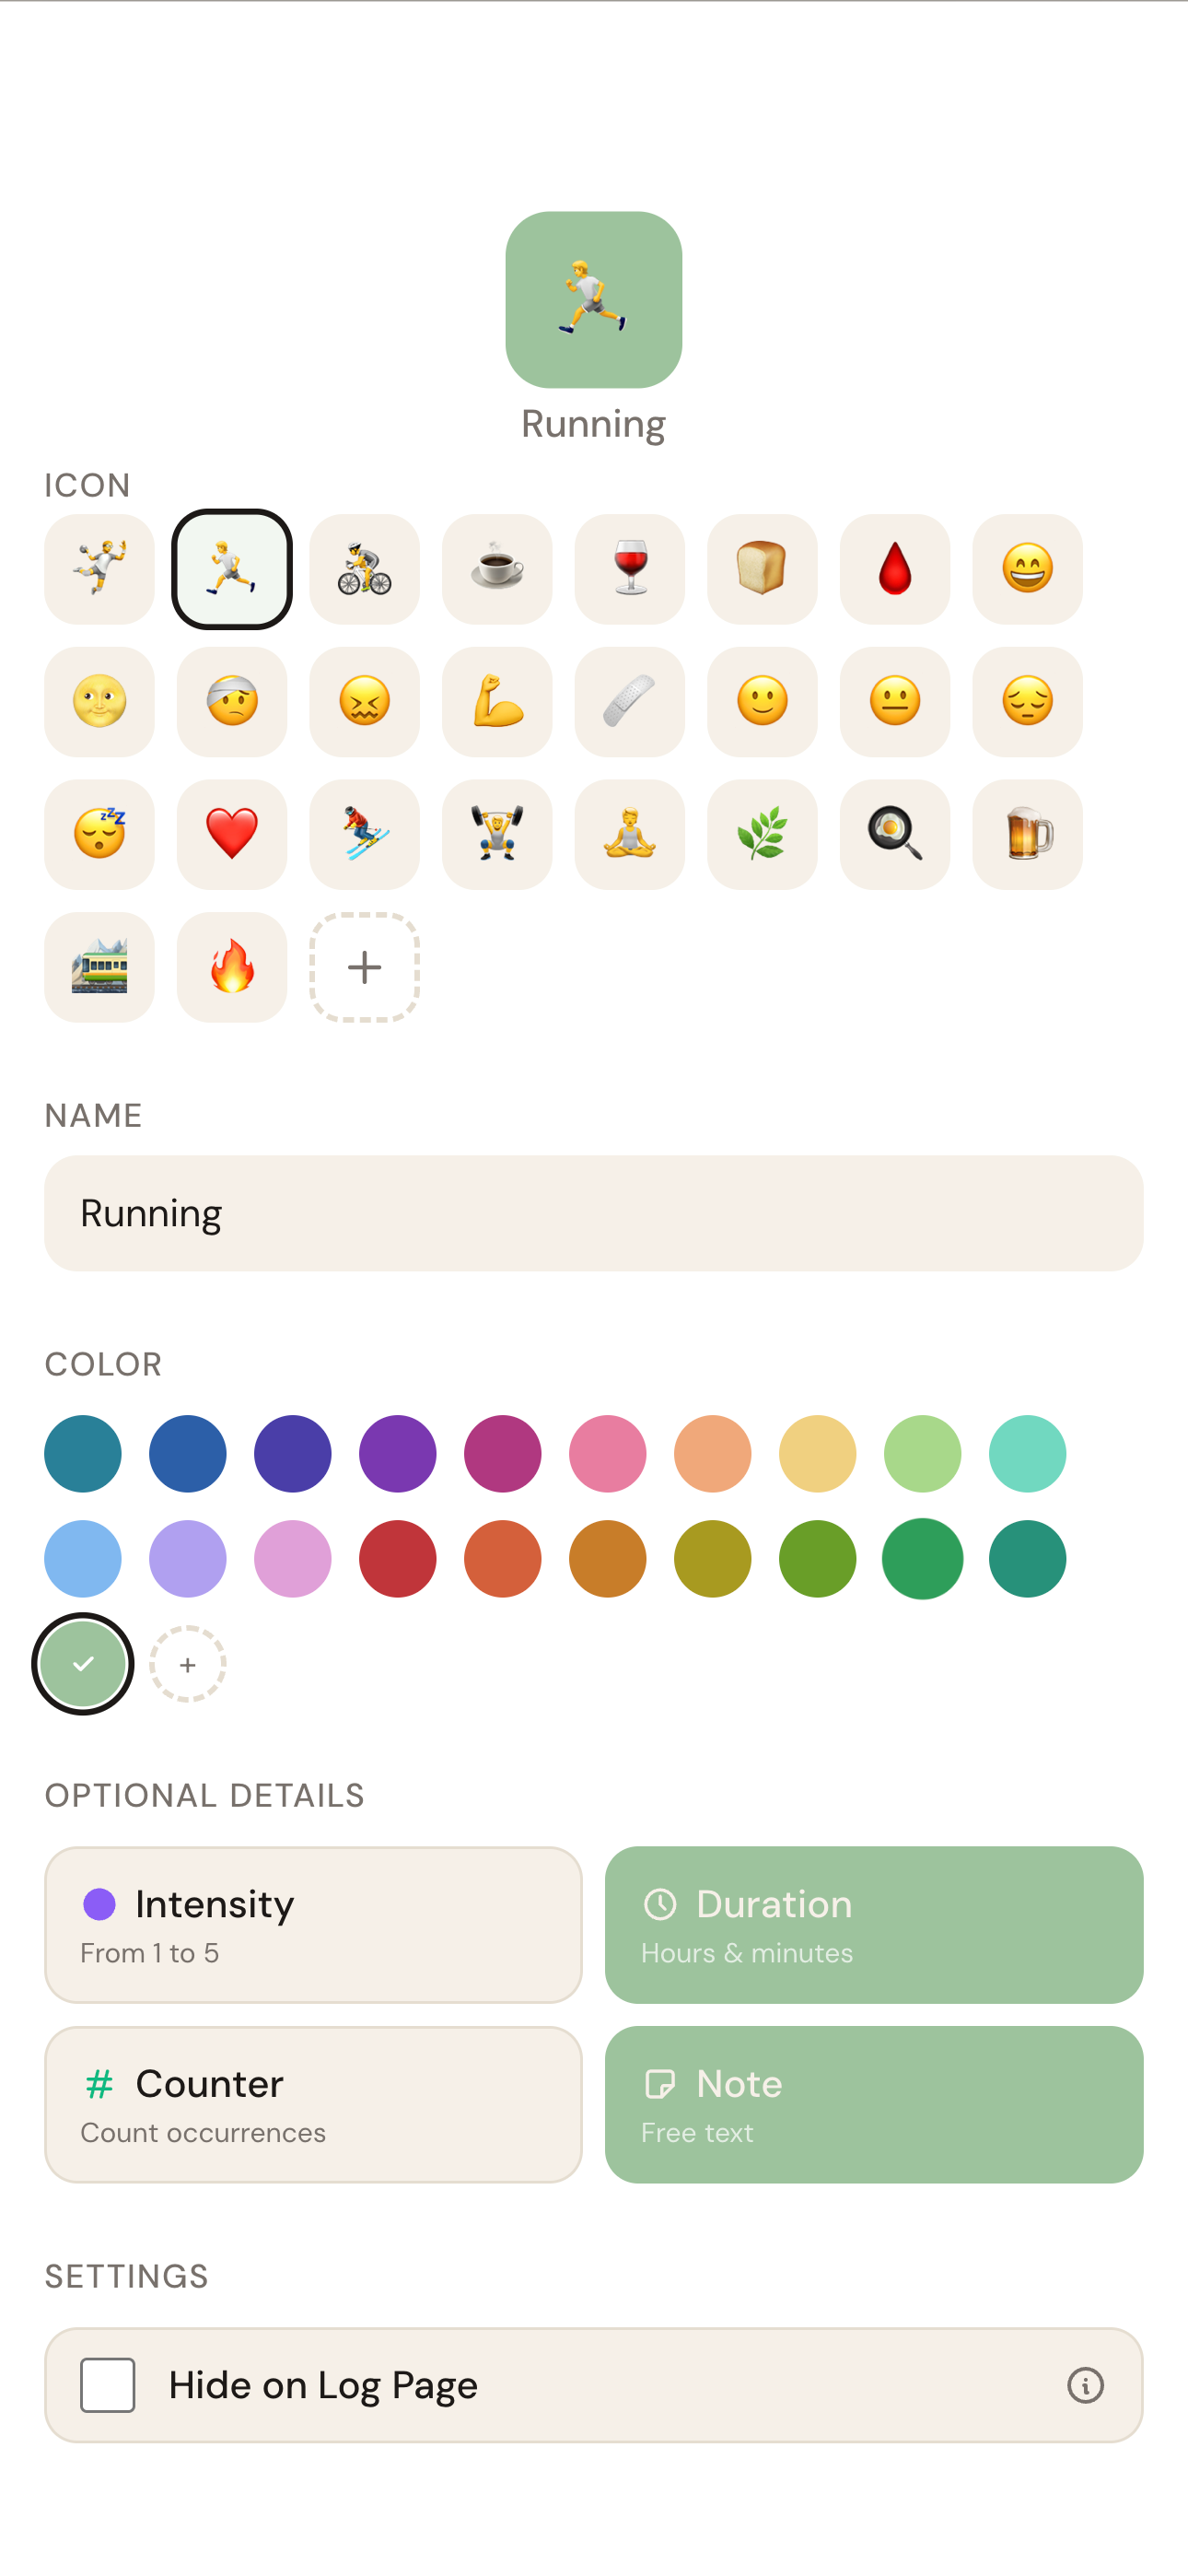
Dress your entries in your colors. Pick from ~1 600 emoji icons you already know. Decide per tile which details it asks for — duration, a 1–5 rating, a count, a note — so you only ever log what actually matters.
On days you log gluten, skin rash appears 92% of the time.
Where it shines
A pure logger keeps the record. Log Simply reads it: every chart comes with its statistics, and Insights surface connections between your entries — ranked by how strong they are and how much data backs them, each with a confidence badge.
Your data
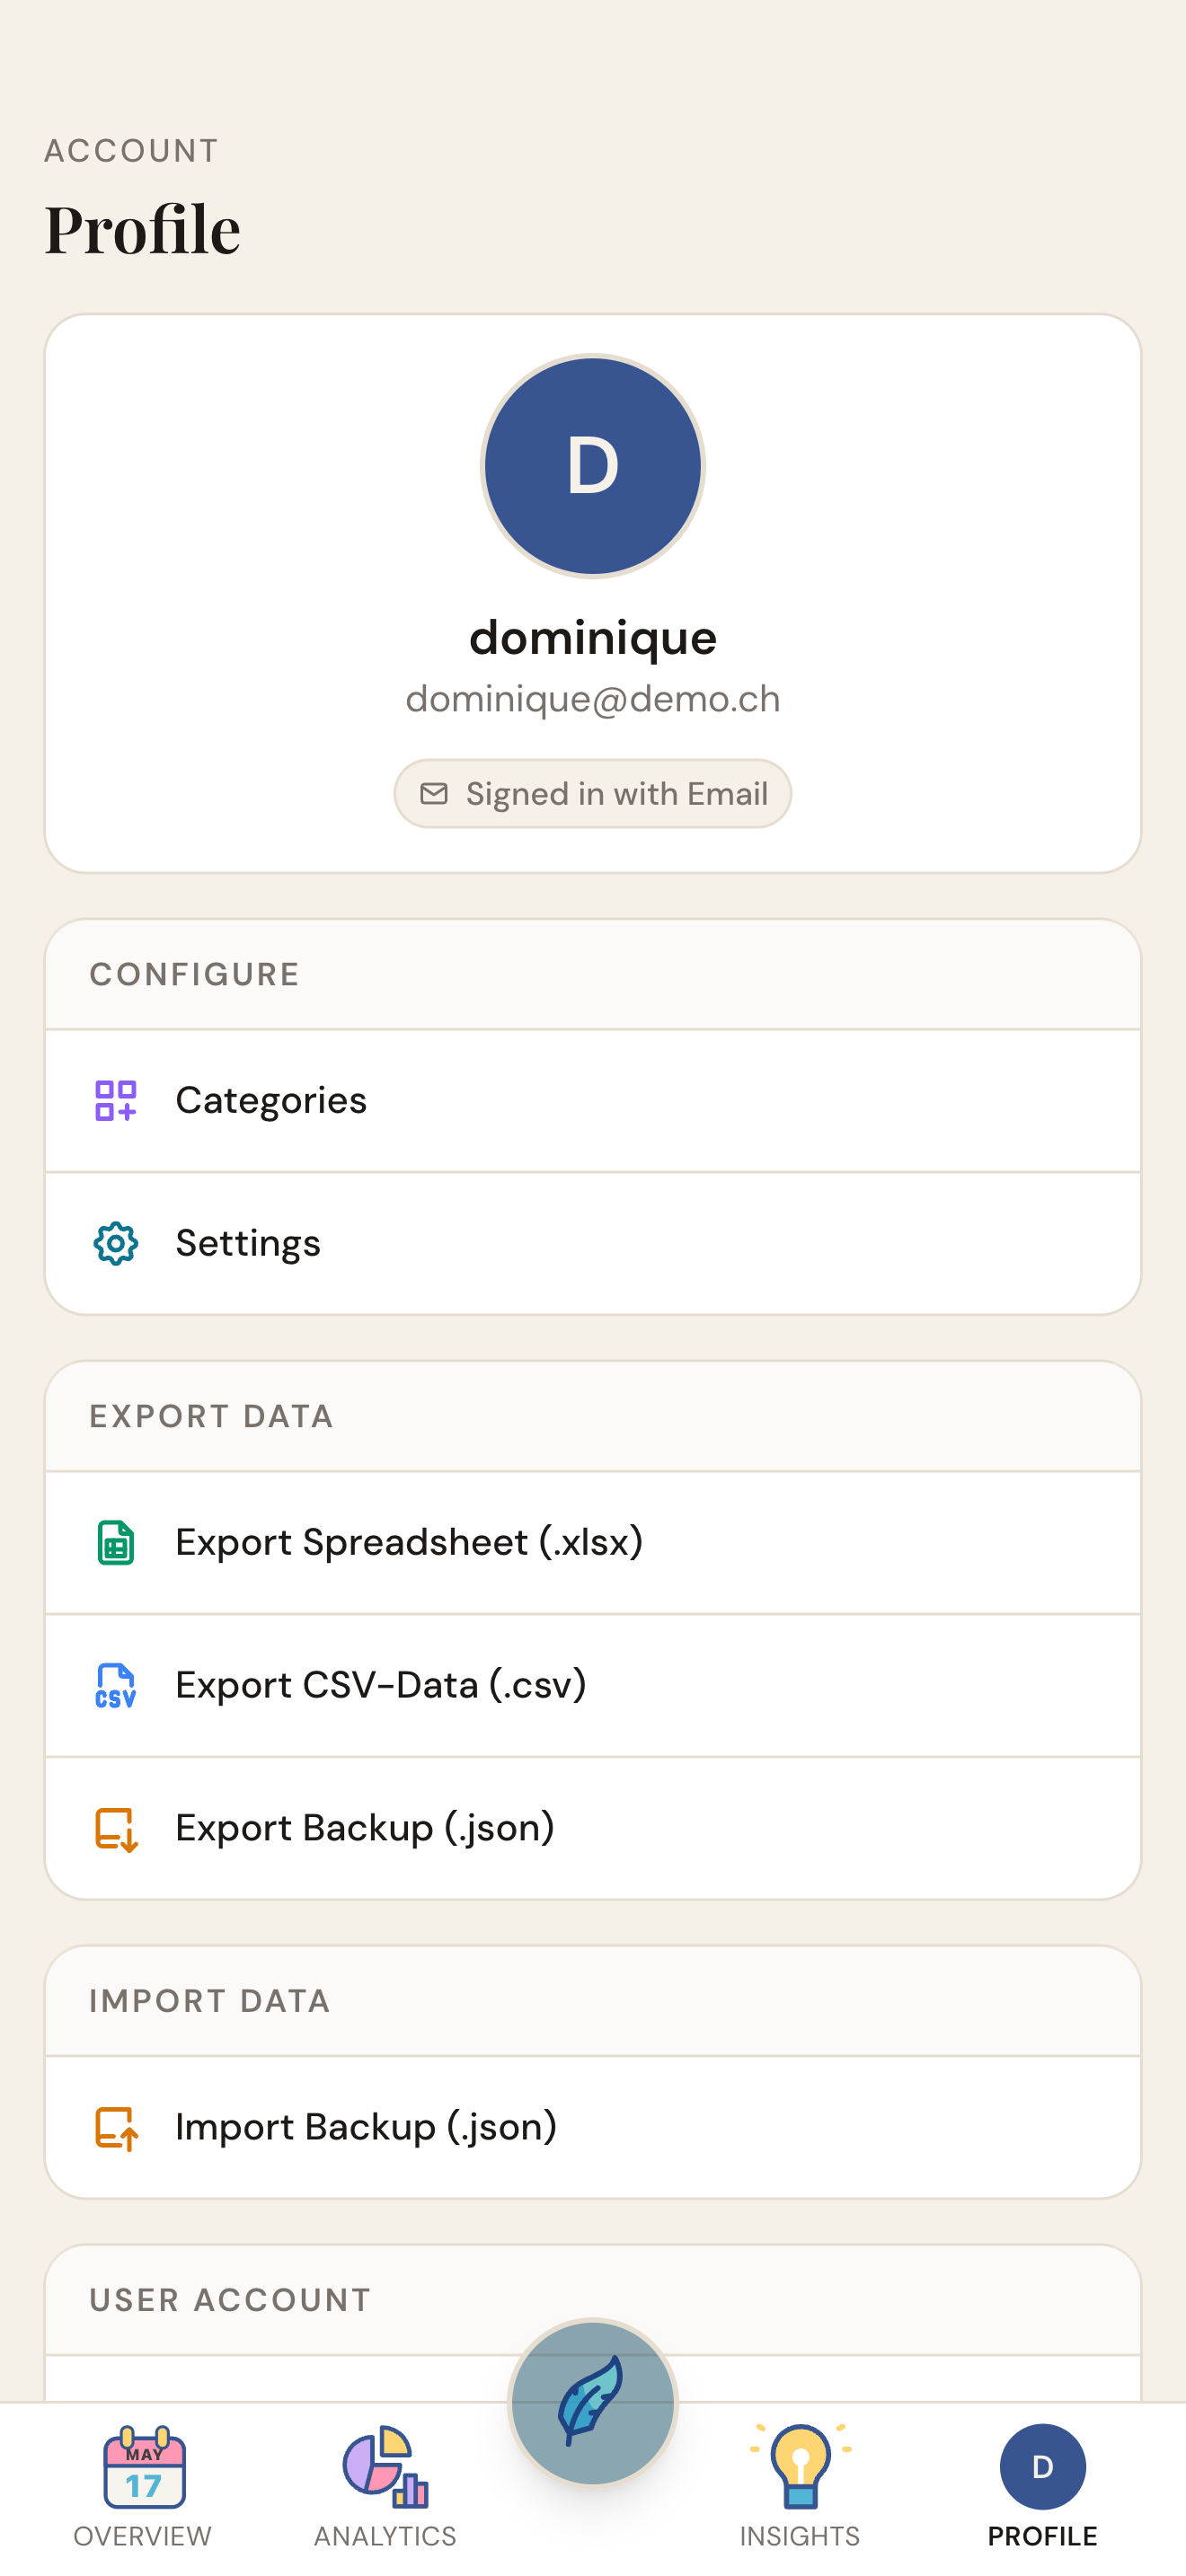
Export everything to Excel to dig deeper into your data if you like. Take a one-tap backup; restore it just as easily. Deleting your account is just as easy as creating one.
A short note on privacy
Log Simply stores your data anonymously, in a secured database in Switzerland — only you have access to your entries. We don't sell them. We don't share them. We don't analyze them. You can delete or export everything any time.
Read the full privacy policy →